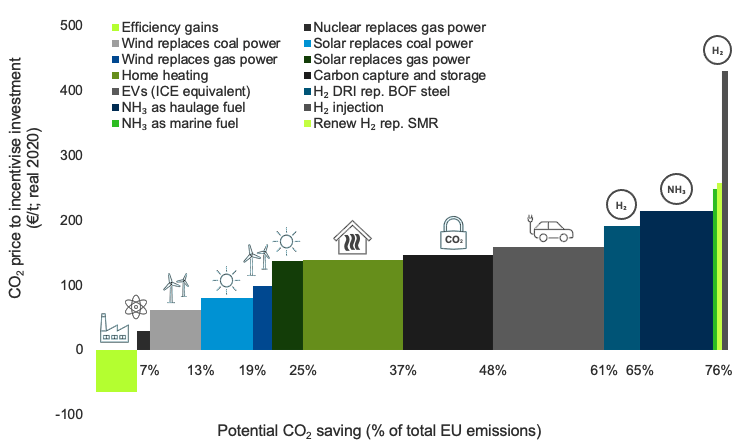
CRU’s Carbon Abatement Curve, focused on the EU, reflects the full costs of transitioning to low-carbon technologies across various areas of the economy, with an initial assumption of zero subsidy. As such, it provides a ‘pure’ view of the costs of transition and, therefore, the price of carbon that is needed to encourage the switch from a purely economic basis. A simple reading of the curve implies a price of ~€140 /tCO2 (real 2020; ~€170 /tCO2 nominal) by 2030, without subsidy, to achieve ‘Fit for 55’ emission reduction targets. This compares with a current carbon price of ~€60 /tCO2. If the ‘Fit for 55’ objectives are to be realised, either the EU carbon price will have to rise, or increased subsidies will be required.
The curve shows just how more costly some parts of the economy are to abate (e.g. steel versus power). Also, the fact that a positive CO2 price is needed implies that low-carbon options will be more expensive than traditional in all cases. That is, without subsidy, steel and power prices, for example, will need to rise to support the decarbonisation transition.

Decarbonisation will be expensive
The decarbonisation transition will be expensive, there is no escaping that. For example, although renewable energy costs have fallen significantly from the early days of solar and wind energy development, they remain, at best, on a par with fossil alternatives and, in many cases, are still more expensive when no carbon charges or subsidy apply. Also, the additional costs that are incurred to allow variable renewable energy to provide base load power mean that, in all cases where no subsidy or carbon charges apply, renewable energy will be more expensive than fossil energy on a like-for-like basis. Currently, these additional costs are absorbed by the power grid – via expensive variable power generation at fossil plants – and transferred to customers or are subsidised but, as renewable energy takes a greater share of power generation, they will need to be internalised into the renewable costs’ equation.
Taking this further, based on the full costs of alternative, low-carbon technologies applicable across a range of activities in the economy, below we have constructed CRU’s Carbon Abatement Curve for the EU, which sets out the CO2 price needed to incentivise technology change and the percentage of emissions that can be reduced.
Figure 1: CO2 carbon abatement curve, economy-wide, 2030, EU

DATA: CRU Sustainability. NOTE: SMR = steam methane reforming; DRI = direct reduced iron; ICE = internal combustion engine
The abatement curve gives the full cost, without subsidy
The abatement curve above has been constructed based on best estimates of the upfront capex., or technology conversion, and opex. costs of the relevant decarbonisation technology relative to the traditional technology. In simple terms, the carbon price is raised to lift the cost of the traditional technology to a level such that investment in the low-carbon alternative becomes a viable proposition and will provide returns. The fact that the carbon price is positive for all elements of the abatement curve except energy efficiency means that the low-carbon alternatives will be more expensive overall without subsidy.
The latter point – subsidy, in whatever form – is an important consideration. As presented, the abatement curve assumes zero subsidy, therefore, it is based on a ‘pure’ cost of conversion to the low-carbon alternative. However, where subsidy is available, a lower carbon price would apply.
To illustrate, recent offshore windfarm developments in the Netherlands receive a guaranteed feed-in-tariff of ~€73 /MWh or higher excluding transmission costs, against a typical wholesale price of €45 /MWh (n.b. current wholesale electricity prices are much higher due to very high natural gas prices). Our analysis suggests that the €73 /MWh slightly overcompensates the windfarm developers and that returns on these investments should be good. However, the high feed-in-tariff is only one form of effective subsidy applied here. Transmission costs for offshore wind farms (i.e. getting the electricity from offshore to the power grid) are high and are increasing as windfarms are located further out from shore. In this instance, these costs are entirely borne by the power grid. Thirdly, wind power is variable, therefore, some form of supply management will need to be practised to smooth out the supply of electricity provided. This may take the form of variable operation of traditional fossil plants, some form of storage or more variable imports/exports of power from/to other countries that, in all cases, are expensive.
Our analysis shows that the equivalent CO2 price of these subsidies, assuming the wind farm replaces coal-fired power (n.b. equivalent values when replacing natural gas power in brackets) are, variously:
- Feed-in-tariff: €32 (€68) /tCO2
- Transmission costs: €16 (€35) /tCO2
- Supply management: €12 (€28) /tCO2
- Total: ~€60 (€131) /tCO2
Thus, while renewables have fallen in cost, when you consider the full cost of renewables providing base load power into the grid, these costs are relatively high (n.b. the ‘subsidy’ calculations above reflect the CO2 price given in the abatement curve for these technology options).
The abatement curve gives a hierarchy of decarbonisation options
Having said that, decarbonisation will progress via different technologies relevant to different parts of the economy and the relative costs of these technologies versus traditional operations will differ. That is, the costs of decarbonising will be different for different parts of the economy and, as such, they will require a different carbon price – or, indeed, level of subsidy – to incentivise change. As such, the abatement curve presented here – focused on Europe – sets out the carbon price needed to incentivise decarbonisation in different parts of the economy based on the underlying costs (n.b. capex. and opex.) of the low-carbon technology alternatives and assuming no subsidy.
Interestingly, this analysis shows that, after energy saving measures, decarbonisation of the power grid is one of the lowest cost options for reducing CO2 emissions. At the same time, the technology for doing so (e.g. renewable power, storage options etc.) are proven and commercialised and, because of this, we believe the transition of the power grid will provide the major route to carbon reduction up to 2030. Only beyond this time will more expensive technology options relevant to other parts of the economy, but which are not yet fully commercialised, become prevalent.
Using the CRU Abatement Curve to forecast carbon prices
At the very simplest level, CRU’s Carbon Abatement Curve can be used to read off the carbon price needed to incentivise a given reduction in CO2 emissions. For example, the ‘Fit for 55’ target is for a 55% reduction in carbon emissions in the EU relative to 1990 emissions, equivalent to a 38% reduction from 2019, pre-Covid-19 levels. A straightforward reading of the abatement curve suggests a 38% reduction requires carbon price of ~€140 /tCO2, which is sufficiently high to incentivise investment in solar to replace natural gas and air source heat pumps for home heating, the marginal abatement options. However, it is likely that some form of subsidy will apply (n.b. given the public outcry when energy prices rise), meaning a lower CO2 price would be applicable.
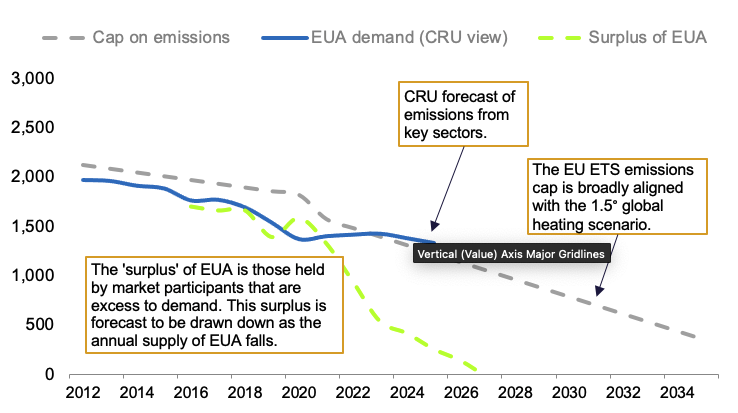
The abatement curve can also be combined with CRU’s modelled forecast for the availability of EU allowances (EUA) under EU ETS. According to our forecasts of emissions, the availability of EUA – which are currently in surplus – is likely to start tightening significantly from 2024 onwards and this will start to put upward pressure on carbon prices.
Figure 2: EU Emissions Allowances, million EUA

DATA: CRU Sustainability. NOTE: CRU view of EUA demand is built up from CRU Analysis medium-term forecasts of activity in key sectors (e.g., power generation, steel, cement, and ammonia production)
As indicated, transition of the power grid provides some of the lowest cost emission abatement options and, as the supply of EUA into the EU ETS tightens from 2023 onwards, we believe prices will rise to a level to incentivise this transition in the first instance.
At the same time, higher CO2 prices will increasingly disadvantage other sectors of the economy that suffer to a greater extent from carbon leakage (e.g. steel) and, given the transition in these sectors will occur over a longer timeframe, production would be expected to fall back, which will contribute to balancing of the overall market for EUA.
If you would like to discuss CRU’s Carbon Abatement Curve further or its implications for carbon prices in the near and longer term, please get in touch using the details provided. We’ll be very happy to talk through our thinking and to hear how we can help you.
Find out more about our Sustainability Services.
Our reputation as an independent and impartial authority means you can rely on our data and insights to answer your big sustainability questions.
Tell me more
